Zone Counting
Overview
Zone counting creates different zones within a single image and counts the number of objects within each zone separately. This is useful in many applications, such as counting vehicles travelling on one side of a road, or counting the shoppers entering a mall.
See also
To only count objects within a single zone and ignore all other objects, see the Tracking People within a Zone tutorial.
Zone counting is done by counting the number of objects detected by the object detection models that fall within the specified zones. For example, we can count the number of people in the blue and red zones, as shown in the GIF above. This is explained in the How It Works section.
Demo
To try our solution on your own computer, install and run PeekingDuck with the configuration file zone_counting.yml as shown:
Terminal Session
How It Works
There are three main components to obtain the zone counts:
The detections from the object detection model, which are the bounding boxes,
The bottom midpoint of the bounding boxes, derived from the bounding boxes, and
The zones, which can be set in the
dabble.zone_countconfigurable parameters.
1. Object Detection
We use an open source object detection model known as YOLOv4
and its smaller and faster variant known as YOLOv4-tiny to identify the bounding boxes of objects
we want to detect. This allows the application to identify where objects are
located within the video feed. The location is returned as a pair of
x, y coordinates in the form \([x_1, y_1, x_2, y_2]\),
where \((x_1, y_1)\) is the top left corner of the bounding box, and \((x_2, y_2)\) is the
bottom right. These are used to form the bounding box of each object detected. For more information
on how to adjust the yolo node, check out its
configurable parameters.
2. Bounding Box to Bottom Midpoint
Given the top left \((x_1, y_1)\) and bottom right \((x_2, y_2)\) coordinates of each bounding box, the bottom midpoint \((x_{bm}, y_{bm})\) can be computed by taking lowest y coordinate \(y_{bm} = y_2\), and the midpoint of the x coordinates \(x_{bm} = (x1 + x2) / 2\).
We found that using the bottom midpoint is the most efficient way to tell if something is in a specified zone. We attribute this to the use of the top-down or angled camera footages, which are commonly found in the use cases. The bottom midpoints of the bounding boxes usually correspond to the locations of the objects in these footages.
3. Zones
Zones are created by specifying the x, y coordinates of all the corner points that form the area of the zone in a clockwise direction. The coordinates can be in either fractions of the resolution or pixels. As an example, blue zone in the zone counting GIF was created using the following zone:
[[0, 0], [0.6, 0], [0.6, 1], [0, 1]]
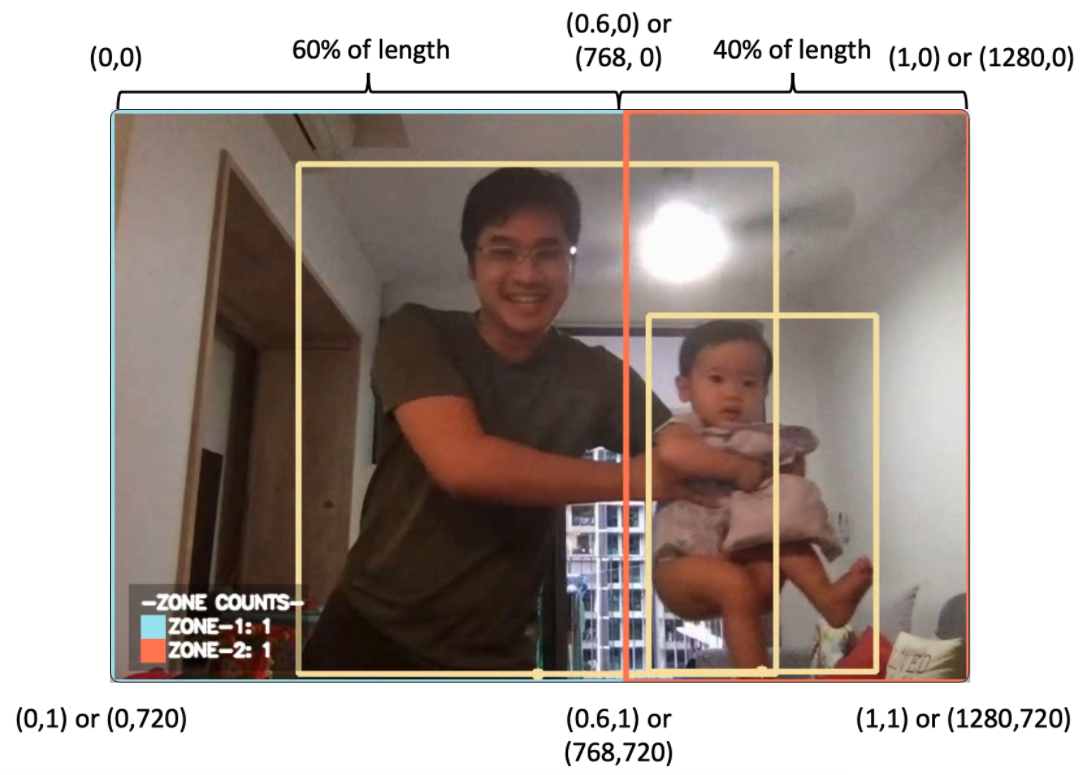
Given a resolution of 1280 by 720, these correspond to the top-left of the image, 60% of the length at the top of the image, 60% of the length at the bottom of the image, and the bottom-left of the image. These points form the rectangular blue zone in a clockwise direction.
Note that because the x, y coordinates are fractions of the image resolution, the resolution
config for dabble.zone_count needs to be set correctly.
For finer control over the exact coordinates, the pixel coordinates can be used instead. Using the same example, the blue zone can be created using the following zone configuration:
[[0, 0], [768, 0], [768, 720], [0, 720]]
When using pixel coordinates, the resolution is not needed. However, users should check to ensure that the pixel coordinates given fall within the image resolution so that the zone will work as intended.
Elaboration for this adjustment can be found the “4. Adjusting Nodes” section.
Note
Zones do not have to be rectangular in shape. They can be of any polygonal shape, dictated by the number and position of the x, y coordinates set in a zone.
4. Zone Counts
Given the bottom midpoints of all detected objects, we check if the points fall within the areas of the specified zones. If it falls inside any zone, an object count is added for that specific zone. This continues until all objects detected are accounted for, which gives the final count of objects in each specified zone.
Nodes Used
These are the nodes used in the earlier demo (also in zone_counting.yml):
nodes:
- input.visual:
    source: 0
- model.yolo:
    detect: ["person"]
- dabble.bbox_to_btm_midpoint
- dabble.zone_count:
    resolution: [1280, 720] # Adjust this to your camera's input resolution
    zones: [
    [[0, 0], [0.6, 0], [0.6, 1], [0, 1]],
    [[0.6, 0], [1, 0], [1, 1], [0.6, 1]]
    ]
- draw.bbox
- draw.btm_midpoint
- draw.zones
- draw.legend:
    show: ["zone_count"]
- output.screen
1. Object Detection Node
By default, the node uses the YOLOv4-tiny model for object detection, set to detect people. Please take a look at the benchmarks of object detection models that are included in PeekingDuck if you would like to use a different model or model type better suited to your use case.
2. Bottom Midpoint Node
The bottom midpoint node is called by including dabble.bbox_to_btm_midpoint in the pipeline
config declaration. This outputs the bottom midpoints of all detected bounding boxes. The node
has no configurable parameters.
3. Zone Counting Node
The zone counting node is called by including dabble.zone_count in the run config
declaration. This uses the bottom midpoints of all detected bounding boxes and outputs the number
of object counts in each specified zone. The node configurable parameters can be found below.
4. Adjusting Nodes
The zone counting detections depend on the configuration set in the object detection models, such
as the type of object to detect, etc. For the object detection model used in this demo, please see
the yolo node documentation for adjustable behaviors that can
influence the result of the zone counting node.
With regards to the zone counting node, some common node behaviors that you might need to adjust are:
resolution: If you are planning to use fractions to set the coordinates for the area of the zone, the resolution should be set to the image/video/livestream resolution used.zones: Used to specify the different zones which you would like to set. The coordinates for each zone are given in a list in a clockwise order. See the Nodes Used section on how to properly configure multiple zones.
For more adjustable node behaviors not listed here, check out the API Documentation.