PeekingDuck includes some “power” nodes that are capable of processing the contents
or outputs of the other nodes and to accumulate information over time.
An example is the dabble.statistics node which can accumulate statistical
information, such as calculating the cumulative average and maximum of particular
objects (like people or cars).
This tutorial presents advanced recipes to showcase the power features of
PeekingDuck, such as using dabble.statistics for object counting and tracking.
This tutorial demonstrates how to save data to an SQLite database.
We will extend the tutorial for counting hand waves
with a new custom output node that writes information into a local SQLite database.
Note
The above tutorial assumes sqlite3 has been installed in your system.
If your system does not have sqlite3, please see the SQLite Home Page for installation instructions.
First, create a new custom output.sqlite node in the custom_project folder:
Terminal Session
[~user/wave_project] > peekingduck create-node
Creating new custom node…
Enter node directory relative to ~user/wave_project [src/custom_nodes]: ⏎
Select node type (input, augment, model, draw, dabble, output): output
1# Mandatory configs2input:["hand_direction","num_waves"]3output:["none"]45# No optional configs
The new output.sqlite custom node will take in the hand direction and the
current number of hand waves to save to the external database.
src/custom_nodes/output/sqlite.py:
Show/Hide Code for sqlite.py
1""" 2Custom node to save data to external database. 3""" 4 5fromtypingimportAny,Dict 6fromdatetimeimportdatetime 7frompeekingduck.pipeline.nodes.abstract_nodeimportAbstractNode 8importsqlite3 910DB_FILE="wave.db"# name of database file111213classNode(AbstractNode):14"""Custom node to save hand direction and current wave count to database.1516 Args:17 config (:obj:`Dict[str, Any]` | :obj:`None`): Node configuration.18 """1920def__init__(self,config:Dict[str,Any]=None,**kwargs:Any)->None:21super().__init__(config,node_path=__name__,**kwargs)2223self.conn=None24try:25# try to establish connection to database,26# will create DB_FILE if it does not exist27self.conn=sqlite3.connect(DB_FILE)28self.logger.info(f"Connected to {DB_FILE}")29sql=""" CREATE TABLE IF NOT EXISTS wavetable (30 datetime text,31 hand_direction text,32 wave_count integer33 ); """34cur=self.conn.cursor()35cur.execute(sql)36exceptsqlite3.Errorase:37self.logger.info(f"SQL Error: {e}")3839defupdate_db(self,hand_direction:str,num_waves:int)->None:40"""Helper function to save current time stamp, hand direction and41 wave count into DB wavetable.42 """43now=datetime.now()44dt_str=f"{now:%Y-%m-%d %H:%M:%S}"45sql=""" INSERT INTO wavetable(datetime,hand_direction,wave_count)46 values (?,?,?) """47cur=self.conn.cursor()48cur.execute(sql,(dt_str,hand_direction,num_waves))49self.conn.commit()5051defrun(self,inputs:Dict[str,Any])->Dict[str,Any]:# type: ignore52"""Node to output hand wave data into sqlite database.5354 Args:55 inputs (dict): Dictionary with keys "hand_direction", "num_waves"5657 Returns:58 outputs (dict): Empty dictionary59 """6061hand_direction=inputs["hand_direction"]62num_waves=inputs["num_waves"]63self.update_db(hand_direction,num_waves)6465return{}
This tutorial uses the sqlite3 package to interface with the database.
On first run, the node initializer will create the wave.db database file.
It will establish a connection to the database and create a table called
wavetable if it does not exist.
This table is used to store the hand direction and wave count data.
A helper function update_db is called to update the database.
It saves the current date time stamp, hand direction and wave count into the
wavetable.
The node’s run method retrieves the required inputs from the pipeline’s
data pool and calls self.update_db to save the data.
src/custom_nodes/configs/dabble/wave.yml:
1# Dabble node has both input and output2input:["img","bboxes","bbox_scores","keypoints","keypoint_scores"]3output:["hand_direction","num_waves"]45# No optional configs
To support the output.sqlite custom node’s input requirements, we need to
modify the dabble.wave custom node to return the current hand direction
hand_direction and the current wave count num_waves.
This file is the same as the wave.py in the counting hand
waves tutorial, except for the changes in the last few
lines as shown above.
These changes outputs the hand_direction and num_waves to the pipeline’s
data pool for subsequent consumption by the output.sqlite custom node.
pipeline_config.yml:
11...same as previous ...12- custom_nodes.output.sqlite
Likewise, the pipeline is the same as in the previous tutorial, except for
line 12 that has been added to call the new custom node.
Run this project with peekingduck run and when completed, a new wave.db
sqlite database file would be created in the current folder.
Examine the created database as follows:
Terminal Session
[~user/wave_project] > sqlite3
SQLite version 3.37.0 2021-11-27 14:13:22
Enter “.help” for usage hints.
Connected to a transient in-memory database.
Use “.open FILENAME” to reopen on a persistent database.
sqlite> .open wave.db
sqlite> .schema wavetable
CREATE TABLE wavetable (
datetime text,
hand_direction text,
wave_count integer
);
sqlite> select * from wavetable where wave_count > 0 limit 5;
2022-02-15 19:26:16|left|1
2022-02-15 19:26:16|right|1
2022-02-15 19:26:16|left|2
2022-02-15 19:26:16|right|2
2022-02-15 19:26:16|right|2
sqlite> select * from wavetable order by datetime desc limit 5;
This tutorial demonstrates using the dabble.statistics node to count the number
of cars traveling across a highway over time and the draw.legend node to display
the relevant statistics.
Create a new PeekingDuck project, download the highway cars video and save it into the project
folder.
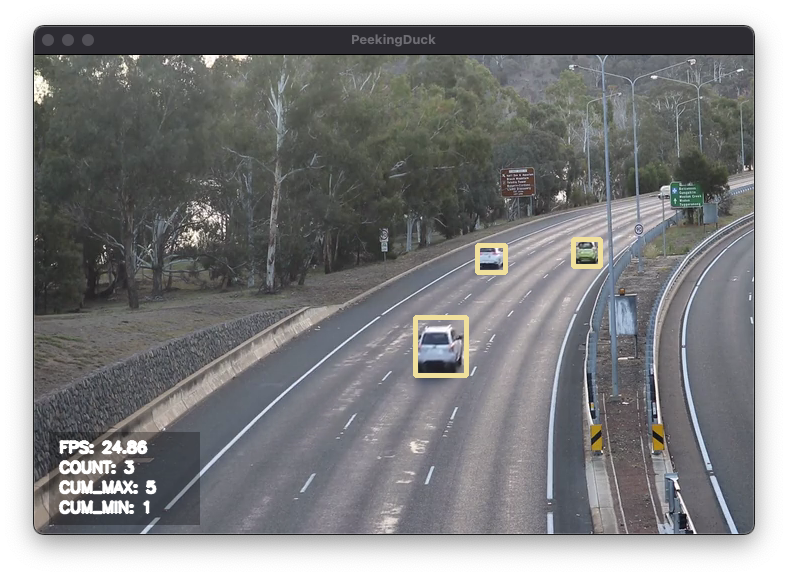
Run it with peekingduck run and you should see a video of cars travelling
across a highway with a legend box on the bottom left showing the realtime count of the
number of cars on-screen, the cumulative maximum and minimum number of cars detected
since the video started.
The sample screenshot below shows:
the count that there are currently 3 cars on-screen
the cumulative maximum number of cars “seen” previously was 5
Object tracking is the application of CV models to automatically detect objects
in a video and to assign a unique identity to each of them.
These objects can be either living (e.g. person) or non-living (e.g. car).
As they move around in the video, these objects are identified based on
their assigned identities and tracked according to their movements.
This tutorial demonstrates using dabble.statistics with a custom node to
track the number of people walking down a path.
Create a new PeekingDuck project, download the people walking video and save it into the project
folder.
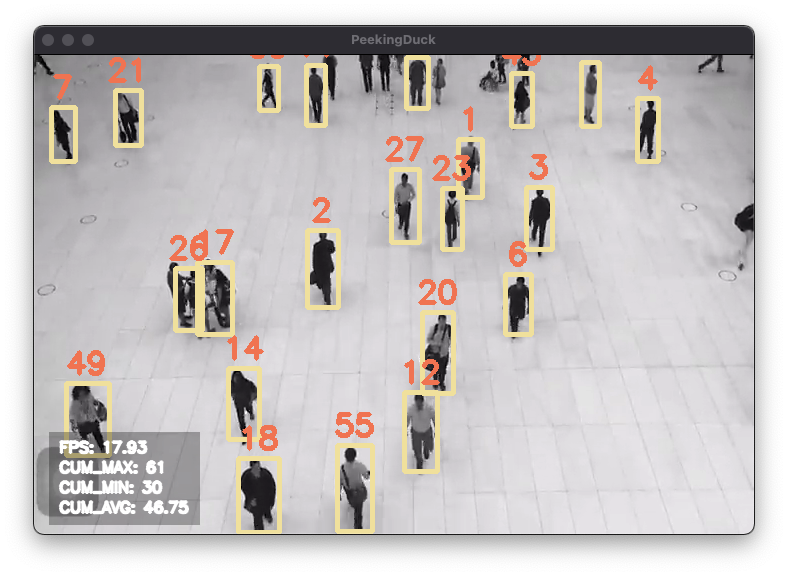
The above pipeline uses the YOLO model to detect people in the video and uses
the dabble.tracking node to track the people as they walk.
Each person is assigned a tracking ID and dabble.tracking returns a list of
tracking IDs.
dabble.statistics is used to process these tracking IDs: since each person is
assigned a monotonically increasing integer ID, the maximum ID within the list
tells us the number of persons tracked so far.
draw.tag shows the ID above the tracked person.
draw.legend is used to display the various statistics: the FPS, and the
cumulative maximum, minimum and average relating to the number of persons tracked.
Do a peekingduck run and you will see the following display:
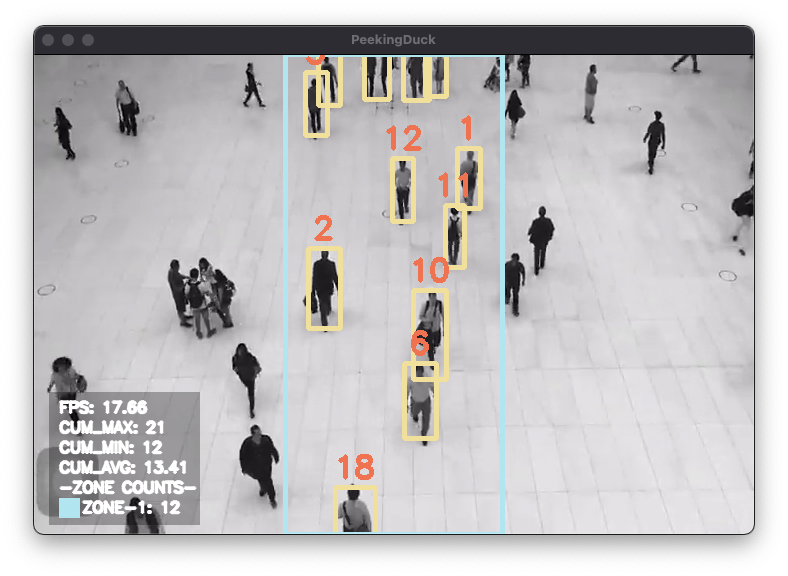
Suppose we are only interested in people walking down the center of the video
(imagine a carpet running down the middle).
We can create a custom node to tell PeekingDuck to focus on the middle zone,
by filtering away the detected bounding boxes outside the zone.
Start by creating a custom node dabble.filter_bbox:
Terminal Session
[~user/people_walking] > peekingduck create-node
Creating new custom node…
Enter node directory relative to ~user/people_walking [src/custom_nodes]: ⏎
Select node type (input, augment, model, draw, dabble, output): dabble
We make use of dabble.zone_count and dabble.bbox_to_btm_midpoint nodes to
create a zone in the middle. The zone is defined by a rectangle with the
four corners (0.35, 0.0) - (0.65, 0.0) - (0.65, 1.0) - (0.35, 1.0).
(For more info, see Zone Counting)
This zone is also defined in our custom node dabble.filter_bbox for bounding box
filtering.
What dabble.filter_bbox will do is to take the list of bboxes as input and
output a list of bboxes within the zone, dropping all bboxes outside it.
Then, dabble.tracking is used to track the people walking and
dabble.statistics is used to determine the number of people walking in the zone,
by getting the maximum of the tracked IDs.
draw.legend has a new item zone_count which displays the number of people
walking in the zone currently.
The filter_bbox.yml and filter_bbox.py files are shown below:
The zones default value of [[0,0],[0,1],[1,1],[1,0]] will be overridden
by those specified in pipeline_config.yml above.
See Configuration - Behind The Scenes for more
details.
src/custom_nodes/dabble/filter_bbox.py:
Show/Hide Code for filter_bbox.py
1""" 2Custom node to filter bboxes outside a zone 3""" 4 5fromtypingimportAny,Dict 6importnumpyasnp 7frompeekingduck.pipeline.nodes.abstract_nodeimportAbstractNode 8 910classNode(AbstractNode):11"""Custom node to filter bboxes outside a zone1213 Args:14 config (:obj:`Dict[str, Any]` | :obj:`None`): Node configuration.15 """1617def__init__(self,config:Dict[str,Any]=None,**kwargs:Any)->None:18super().__init__(config,node_path=__name__,**kwargs)1920defrun(self,inputs:Dict[str,Any])->Dict[str,Any]:# type: ignore21"""Checks bounding box x-coordinates against the zone left and right borders.22 Retain bounding box if within, otherwise discard it.2324 Args:25 inputs (dict): Dictionary with keys "bboxes"2627 Returns:28 outputs (dict): Dictionary with keys "bboxes".29 """30bboxes=inputs["bboxes"]31zones=self.config["zones"]32zone=zones[0]# only work with one zone currently33# convert zone with 4 points to a zone bbox with (x1, y1), (x2, y2)34x1,y1=zone[0]35x2,y2=zone[2]36zone_bbox=np.asarray([x1,y1,x2,y2])3738retained_bboxes=[]39forbboxinbboxes:40# filter by left and right borders (ignore top and bottom)41ifbbox[0]>zone_bbox[0]andbbox[2]<zone_bbox[2]:42retained_bboxes.append(bbox)4344return{"bboxes":np.asarray(retained_bboxes)}
Do a peekingduck run and you will see the following display: